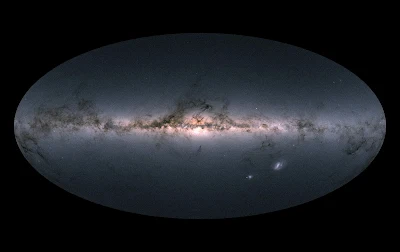
Η αποστολή GAIA χαρτογράφησε 1,7 δισ. άστρα του γαλαξία μας. European Gaia spacecraft’s first major data dump — the most detailed 3D chart yet of our Galaxy — will keep researchers busy for decades. The Milky Way galaxy has been charted by the Gaia mission in unprecedented detail. Credit: ESA/Gaia/DPAC
Ο
Ευρωπαϊκός Οργανισμός Διαστήματος (ESA) έδωσε στην δημοσιότητα ένα τρισδιάστατο
χάρτη του γαλαξία μας στον οποίο είναι σημειωμένα στις θέσεις στις οποίες
βρίσκονται 1,7 δισ. άστρα. Ο χάρτης αυτός είναι προϊόν της λειτουργίας του διαστημικού
παρατηρητηρίου GAIA που εκτοξεύτηκε πριν από πέντε έτη.
Gaia’s all-sky view
of our Milky Way Galaxy and neighbouring galaxies, based on measurements of
nearly 1.7 billion stars. The map shows the total brightness and colour of
stars observed by the ESA satellite in each portion of the sky between July
2014 and May 2016. Brighter regions indicate denser concentrations of
especially bright stars, while darker regions correspond to patches of the sky
where fewer bright stars are observed. The colour representation is obtained by
combining the total amount of light with the amount of blue and red light
recorded by Gaia in each patch of the sky.
The bright horizontal structure that dominates the image is the Galactic
plane, the flattened disc that hosts most of the stars in our home Galaxy. In
the middle of the image, the Galactic centre appears vivid and teeming with
stars. Darker regions across the Galactic plane correspond to foreground clouds
of interstellar gas and dust, which absorb the light of stars located further
away, behind the clouds. Many of these conceal stellar nurseries where new
generations of stars are being born. Sprinkled across the image are also many
globular and open clusters – groupings of stars held together by their mutual
gravity, as well as entire galaxies beyond our own. The two bright objects in the lower right of
the image are the Large and Small Magellanic Clouds, two dwarf galaxies
orbiting the Milky Way. In small areas
of the image where no colour information was available – to the lower left of
the Galactic centre, to the upper left of the Small Magellanic Cloud, and in
the top portion of the map – an equivalent greyscale value was assigned. The
second Gaia data release was made public on 25 April 2018 and includes the
position and brightness of almost 1.7 billion stars, and the parallax, proper
motion and colour of more than 1.3 billion stars. It also includes the radial
velocity of more than seven million stars, the surface temperature of more than
100 million stars, and the amount of dust intervening between us and of 87
million stars. There are also more than 500 000 variable sources, and the
position of 14 099 known Solar System objects – most of them asteroids –
included in the release. Credit: Gaia
Data Processing and Analysis Consortium (DPAC); A. Moitinho / A. F. Silva / M.
Barros / C. Barata, University of Lisbon, Portugal; H. Savietto, Fork Research,
Portugal.
Το
Global astrometric interferometer for astrophysics (Παγκόσμιο Αστρομετρικό
Συμβολόμετρο για την Αστροφυσική) είχε την ικανότητα να μετράει με πολύ μεγάλη
ακρίβεια τις θέσεις και τις αποστάσεις ενός εκατομμυρίου αστέρων την ημέρα. Για
τα περίπου 1,3 δισ. άστρα του χάρτη εκτός από το σημείο στο οποίο βρίσκονται
υπάρχουν και πληροφορίες για την τροχιακή τους κίνηση, την ταχύτητα με την
οποία κινούνται, την απόχρωση που έχουν κ.α.
Gaia's all-sky view
of our Milky Way Galaxy and neighbouring galaxies. The maps show the total
brightness and colour of stars (top), the total density of stars (middle) and
the interstellar dust that fills the Galaxy (bottom). These images are based on
observations performed by the ESA satellite in each portion of the sky between
July 2014 and May 2016, which were published as part of Gaia's second data
release on 25 April 2018. Credit: ESA/Gaia/DPAC
Πρόκειται
στην πραγματικότητα για ένα πραγματικό ωκεανό αστρονομικών δεδομένων στον οποία
η παγκόσμια επιστημονική κοινότητα αδημονεί να… βουτήξει. Η ESA ανακοίνωσε ότι
λίγες μόλις ώρες μετά την δημοσιοποίηση του χάρτη περισσότερα από τρεις
χιλιάδες άτομα «κατέβασαν» τον χάρτη και τα δεδομένα στους υπολογιστές τους.
Animated view of
the 14 099 asteroids in our Solar System, as viewed by ESA’s Gaia satellite
using information from the mission’s second data release. The orbits of the 200
brightest asteroids are also shown, as determined using Gaia data. In future
data releases, Gaia will also provide asteroid spectra and enable a complete
characterisation of the asteroid belt. The combination of dynamical and
physical information that is being collected by Gaia provides an unprecedented
opportunity to improve our understanding of the origin and the evolution of the
Solar System. Credit:
ESA/Gaia/DPAC
«Είμαστε πραγματικά πολύ περίεργοι να δούμε
πώς θα αξιοποιήσει η επιστημονική κοινότητα αυτό το υλικό» δηλώνει ο Αντονι
Μπράουν, του Πανεπιστημίου Leiden στην Ολλανδία που είναι επικεφαλής της ομάδας
επεξεργασίας των δεδομένων της αποστολής GAIA το κόστος της οποίας άγγιξε το 1
δισ. ευρώ.
Πηγές: Gerard
Gilmore. Gaia: 3-dimensional census of the Milky Way Galaxy, Contemporary
Physics (2018). DOI: 10.1080/00107514.2018.1439700 - http://sci.esa.int/gaia/60192-gaia-creates-richest-star-map-of-our-galaxy-and-beyond/
- https://www.nature.com/articles/d41586-018-04979-4 - http://www.tovima.gr/science/physics-space/article/?aid=970585


